Make Your Own Hygrometer
TO MAKE A HYGROMETER, Cut a hole about 2.5 inches from the bottom of an empty plastic bottle and fill the bottle with distilled water up to the opening. Fasten two thermometers to the carton, one with the bulb just above the hole. Wrap cloth around the bulb and push it through the hole into the distilled water. Any water may be used, but distilled water leaves no residue when it evaporates. TO DETERMINE RELATIVE HUMIDITY, allow the hygrometer to stand for 15 minutes in a breeze away from direct sunlight. Read both thermometers and use the temperatures to find the humidity on the chart, below. Read across from the wet-bulb readings. Read downward from the dry-bulb readings. For example, if the dry-bulb thermometer reads 70 degrees F, and the wet-bulb thermometer reads 60 degrees fahrenheit, the relative humidity is 55 percent. |
RELATIVE HUMIDITY TABLE
                     DRY-BULB TEMPERATURE (F)
         64 66 68 70 71 72 73 74 75 76 77 78 79 80 82 84 86 88

    46   18 14 10  6  4  3  1
 W  48   26 21 16 12 10  9  7  5  4  3  1
 E  50   34 29 23 19 17 15 13 11  9  8  6  5  4  3
 T  52   43 36 31 25 23 21 19 17 15 13 12 10  9  7  5  3  1
 |  54   51 44 38 33 30 28 25 23 21 19 17 16 14 12 10  7  5  3
 B  56   60 53 46 40 37 34 32 29 27 25 23 21 19 18 14 12  9  7
 U  58   70 61 54 48 45 42 39 36 34 31 29 27 25 23 20 16 14 11
 L  60   79 71 62 55 52 49 46 43 40 38 35 33 31 29 25 21 18 15
 B  62   90 80 71 64 60 57 53 50 47 44 42 39 37 35 30 26 23 20
    64      90 80 72 68 65 61 58 54 51 48 46 43 41 36 32 28 25
 T  66         90 81 77 73 69 65 62 59 56 53 50 47 42 37 33 30
 E  68            90 86 82 78 74 70 66 63 60 57 54 48 43 39 35
 M  70               95 91 86 82 78 74 71 67 64 61 55 49 44 40
 P  72                     95 91 86 82 79 75 71 68 61 56 50 46
 E  74                           96 91 87 83 79 75 69 62 57 51
 R  76                                 96 91 87 83 76 69 63 57
 A  78                                       96 91 84 76 70 64
 T  80                                             92 84 77 70
 U  82                                                92 84 77
 R  84                                                   92 85
 E  86                                                      92
|
| Differences between tabular and calculated RH may be due to differences in assumptions about wind chill, and heat radiation. For example, the greater the wind speed and the greater the evaporation, the cooler will be the temperature of the wet bulb, even though the actual humidity. |
How the calculation works: 0. Initially, the temperature is converted from Fahrenheit to Celsius. 1. The pressure is assumed to be 101.3 kPa (kiloPascals). 2. A conversion factor is calculated: A = 0.00066 (1.0 + 0.00115 Twb) 3. The saturation vapor pressure is calculated at Twb: eswb = e[(16.78 Twb - 116.9)/(Twb + 237.3)] 4. The water vapor pressure is calculated: ed = eswb - A P (Tdb - Twb) 5. The saturation vapor pressure is calculated at Tdb: esdb = e[(16.78 Tdb - 116.9)/(Tdb + 237.3)] 6. The relative humidity is then calculated: RH = 100 ed/esdb |
Wet Bulb Global Temperature and Apparent Temperature
Source: www.bom.gov.au/info/thermal_stress
About the WBGT and Apparent Temperature Indices
Why are the indices useful?We often use the air temperature as an indicator of how comfortable we will feel when involved in sports or other physical activities. However, the air temperature is only one factor in the assesment of thermal stress. In climates where other important factors, principally humidity, can vary widely from day to day, we need more than just the temperature for a more realistic assessment of comfort. However it is useful to be able to condense all the extra effects into a single number and use it in a similar way to the way we used the temperature. The Wet Bulb Globe Temperature(WBGT) and the Apparent Temperature are indices which attempt to do this.What causes thermal stress?Human thermal comfort depends on environmental and personal factors.The four environmental factors are airflow (wind), air temperature, air humidity, and radiation from the sun and nearby hot surfaces. The personal factors are the clothing being worn and the person's level of physical activity. Thermal sensation is also significantly affected by acclimatisation/adaptation: people living in hot climates have been shown to be comfortable at higher temperatures than those living in cooler climates.
Of the four environmental factors, wind and radiation are very much influenced by the immediate surroundings. For example,
wind speed is reduced by the sheltering effect of belts of trees and solar radiation is affected by short term localised phenomena such as cloudiness.
The Wet Bulb Globe Temperature (WBGT) and Apparent Temperature (AT) are just two methods of combining temperature and humidity into a single number. In fact the real WBGT is also affected by wind and radiation, but the WBGT provided by the Bureau is only an approximation, which ignores variations of wind and radiation (light winds and fairly sunny conditions assumed). The AT can also be extended to take wind and solar radiation into account as well, though generally this is not done. In the AT values provided by the Bureau, wind is taken into account, but not solar radiation. Other indices such as the Physiologically Equivalent
Temperature (PET) and the Predicted Mean Vote (PMV) can also be used. The Wet Bulb Globe Temperature (WBGT)
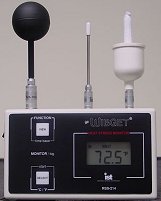
The first temperature, (Tg), is measured by the black globe thermometer, which usually consists of a 150 mm (6 inch) black globe with a thermometer located at the centre. The black globe temperature represents the integrated effects of radiation and wind. The second thermometer (not easily viewed on the picture) measures the natural wet-bulb temperature (Tnwb). It consists of a thermometer with its bulb covered with a wettened cotton wick supplied with distilled water from a reservoir. Evaporation from the wettened bulb cools the thermometer. The natural wet-bulb thermometer, like the black globe thermometer is not shielded from wind or radiation. This thermometer represents the integrated effect of humidity, wind and radiation. The final temperature element is the (shade) air temperature (Ta). It is measured by a thermometer shielded from radiation - generally by being placed in a weather screen. It is the standard temperature normally quoted in weather observations and forecasts.
The three elements Tg, Tnwb, and Ta are combined by into a weighted average to produce the WBGT.
WBGT = 0.7 × Tnwb + 0.2 × Tg + 0.1 × Ta
WBGT instruments are available commercially, but they are fairly expensive and require regular maintenance if they are to produce accurate values. The Bureau of Meteorology does not have WBGT instruments at any of its observation sites. Air temperature and humidity are measured using standard meteorological instruments and screened to shaded the instruments from the sun's radiation. Values for the black globe temperature and natural wet-bulb temperature cannot be accurately determined from a standard meteorological site. Instead the Bureau uses an approximation to the WBGT. This approximation uses standard meteorologically measured temperature and humidity to calculate an estimation of the WBGT under moderately sunny light wind conditions. Real variations of sunshine and wind are not taken into account. The formula is likely to overestimate the WBGT in cloudy or windy conditions, or when the sun is low or below the horizon. Under clear full sun and low humidity conditions the approximation underestimates the WBGT slightly. The formula for the approximation is shown at the end of this document. Although the WBGT is still widely used for heat stress measurements, the basis for its use as a model for human response to heat has been questioned. The effects of the four environmental factors on the WBGT do not necessarily match those of humans under all conditions. In modern heat stress research, sophisticated mathematical models of human response are more often used. The indices apparent temperature (AT), PET and PMV are all based on such heat balance models. These are too complex to be used in practice by organisations such as sports clubs, but are used by meteorologists for tasks such as computing climatologies of thermal sensation. Free software to compute PMV and PET is available on the internet (see References below). Because the Bureau of Meteorology uses an approximation to the WBGT, the user should clearly understand the limitations of this approximation as compared to a real measured WBGT. The fact that the values we produce assume a constant 'moderately sunny' day with 'light winds' may be overlooked, and it might be assumed that we have measured the true WBGT. This can cause confusion. The Apparent Temperature (AT) (see below) does not have this ambiguity and consideration should be made as to whether this is a more appropriate guide for your activity.
The Apparent Temperature (AT) - Heat IndexThe apparent temperature (AT), invented in the late 1970s, was designed to measure thermal sensation in indoor conditions. It was extended in the early 1980s to include the effect of sun and wind. Only the modification due to wind is taken into account on this site. The AT index used here is based on a mathematical model of an adult, walking outdoors, in the shade (Steadman 1994). The AT is defined as; the temperature, at the reference humidity level, producing the same amount of discomfort as that experienced under the current ambient temperature and humidity.Basically the AT is an adjustment to the ambient temperature (T) based on the level of humidity. An absolute humidity with a dewpoint of 14°C is chosen as a reference (this reference is adjusted a little with temperature). If the humidity is higher than the reference then the AT will be higher than the T; and, if the humidity is lower than the reference, then AT will be lower than T. The amount of deviation is controlled by the assumptions of the Steadman human model. In practice the AT is more intuitive to use than the WBGT, as it is an adjustment to the actual air temperature based on the perceived effect of the extra elements such as humidity and wind. AT is valid over a wide range of temperature, and it includes the chilling effect of the wind at lower temperatures - see below. The hot weather version of the AT (1984) is used by the National Weather Service in the United States. In the United States this simple version of the AT is known as the Heat Index. The AT used here does not include the effect of the sun, but this can be factored in. Under Australian conditions the effect of full sun produces a maximum increase in the AT of about 8°C when the sun is at its highest elevation in the sky. The Apparent Temperature (AT) - Wind ChillThe apparent temperature (AT), described in the previous section, can also be used as a measure of wind chill. There are a number of Wind Chill Indices in use around the world, generally for colder temperatures than usually experienced in Australia. Nevertheless, conditions in parts of Australia can be cold enough, under windy conditions, to cause significant chilling. Below is a conversion table with a temperature range suitable for Australian conditions.When using the AT as a wind chill the Steadman model assumes an appropriately dressed adult for those conditions. However if clothing were to get wet, the cooling effect would be greater than that predicted by this model, and the chance of hypothermia would be greater than indicated by the AT. In wet, windy conditions, someone wearing inadequate clothing can become hypothermic in quite mild temperatures. Using the IndicesThe heat indices on the observation page are only a guide to help you make decisions relating to your activity. Your decision process would need to include a number of factors of which temperature and humidity only form part.For more details, sporting clubs should also obtain a copy of the Sports Medicine Australia Heat Policy. It can be downloaded for free from www.sma.org.au or www.coachesedge.com.au. The SMA Fact Sheet Beat the Heat - playing safely in hot weather and their brochure Drink up - Beat the heat are also useful. Sports Medicine Australia (SA) also have a booklet containing a Decision Checklist for sport in South Australia. The actual values might not be appropriate in all states but the methodology might be a useful guide. The booklet is available on the web as Hot Weather Guidelines . By using the conversion tables below, and your own measurements it is possible to determine the value of the heat index at your venue. Electronic thermometers containing relative humidity are available from electronic, and other suppliers, for less that $50. These instruments produce fairly accurate values of relative humidity. Care must be taken to correctly expose the temperature sensor. It should be about a metre above ground level, shaded and away from extraneous radiation sources (for example brick wall) so as to produce an accurate shade temperature. Compare your maximum temperature with a nearby reference weather station. If your value is consistently high, for a reason you can't explain, try another location. To estimate the average conditions of the index you can use the Bureau of Meteorology climate data. Click on the Climate Averages link. You will need to get averages of temperature and relative humidity. On the lower part of the Climate Averages page, choose your state, lookup the nearest observation site to your location, click on the station number. For afternoon conditions you should use the Mean Daily Maximum Temperature and Mean 3pm Relative Humidity. Do not use this relative humidity for other times because relative humidity changes quite a bit during the day. For example if we choose BRISBANE REGIONAL OFFICE, in January we have a temperature of 29.4°C and relative humidity of 59%. From the tables this gives an apparent temperature of about 32°C and a WBGT of about 30°C. See the section on Apparent Temperature for dealing with day/night variations. Conversion TablesSteadman Apparent Temperature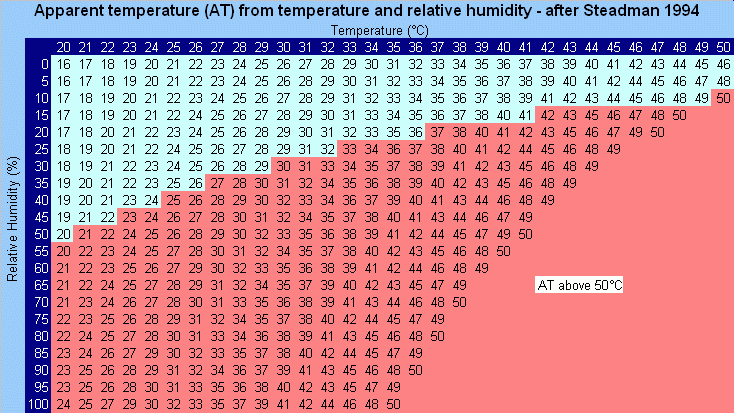 Legend: Red values, apparent temperature above air temperature; blue values, apparent temperature below air temperature
Steadman Apparent Temperature as a Wind Chill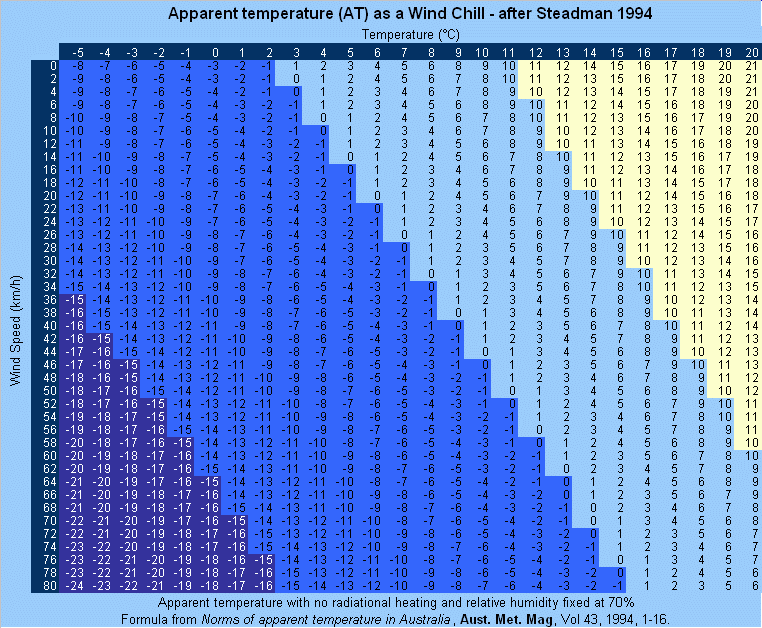 Legend: Colors added to visually deliniate increasingly colder values.
Wet Bulb Globe Temperature Approximation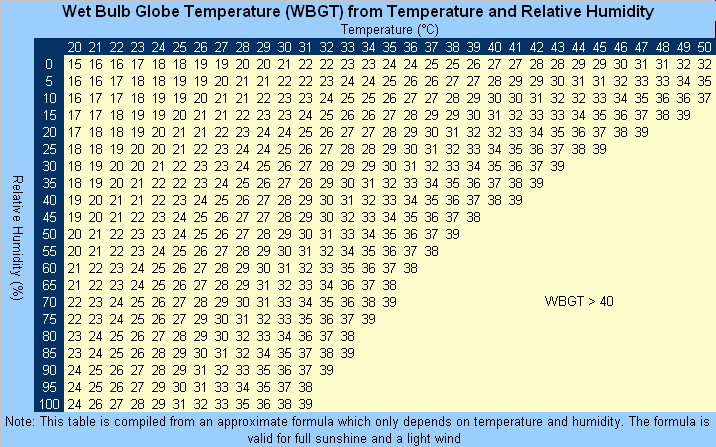
About the approximation to the WBGT used by the Bureau of MeteorologyThe approximation used by the Bureau of Meteorology does not take into account variations in the intensity of solar radiation or of windspeed, and assumes a moderately high radiation level in light wind conditions.Use of this approximation may lead to incorrect estimates of thermal stress, particularly in cloudy and windy conditions. Under these conditions the approximation is likely to lead to an overestimate of the stress. The approximation will also overestimate night-time and early morning conditions when the sun is low or below the horizon. The simplified formula is: WBGT = 0.567 × Ta + 0.393 × e + 3.94
where:
The vapour pressure can be calculated from the temperature and relative humidity using the equation: e = rh / 100 × 6.105 × exp ( 17.27 × Ta / ( 237.7 + Ta ) )
where:
Source: American College of Sports Medicine, Prevention of thermal injuries during distance running - Position Stand. Med.J.Aust. 1984 Dec. 876 About the formula for the apparent temperatureThe formula for the AT used by the Bureau of Meteorology is an approximations of the value provided by a mathematical model of heat balance in the human body. It can include the effects of temperature, humidity, wind-speed and radiation. Two forms are given, one including radiation and one without. On this site we use the non-radiation version.Version including the effects of temperature, humidity, and wind: AT = Ta + 0.33×e − 0.70×ws − 4.00
Version including the effects of temperature, humidity, wind, and radiation: AT = Ta + 0.348×e − 0.70×ws + 0.70×Q/(ws + 10) − 4.25
where:
The vapour pressure can be calculated from the temperature and relative humidity using the equation: e = rh / 100 × 6.105 × exp ( 17.27 × Ta / ( 237.7 + Ta ) )
where:
Source: Norms of apparent temperature in Australia, Aust. Met. Mag., 1994, Vol 43, 1-16 References
| ||||||||||||||||||||